Goodbye, Invoices Not Paid. Hello, Unpaid Invoices and Its Dashboard
Invoices not paid is now Unpaid invoices, the name finance teams use. It shows how old every invoice is, adds up what you are looking at, and comes with a Dashboard of aging, overdue and due by week that you can zoom and filter.

The screen you know as Invoices not paid has a new name: Unpaid invoices. It is the name accounting and finance software uses for the same list, so the platform now uses the same words as your finance team. The name is not the only change. The list now shows how old every invoice is, adds up what you are looking at, and comes with a Dashboard that turns thousands of open invoices into a picture you can read in a few seconds.
This article walks through all of it: what the list shows, what aging means and why it matters, how the Dashboard works, and how to filter the list and see a Dashboard of just those invoices.
The new name, in the same place
You will find Unpaid invoices where Invoices not paid used to be: the button on your ribbon and the link in the Accounting menu both open it. Your saved columns and sort order came with it, so the list opens the way you left it.
Why rename a screen people already know? Because the people who work with these invoices also work in accounting software, and there the list of money customers still owe is called unpaid invoices or receivables. When the same thing has the same name everywhere, there is one less thing to translate in your head, and one less thing to explain to a new person on the team.
What the list shows
Unpaid invoices shows every invoice that still has money owed on it. That includes invoices that are not processed, processed, approved, disputed and partially paid. Invoices that are paid in full or void are left out, so the list is the work that is still open, and nothing else.
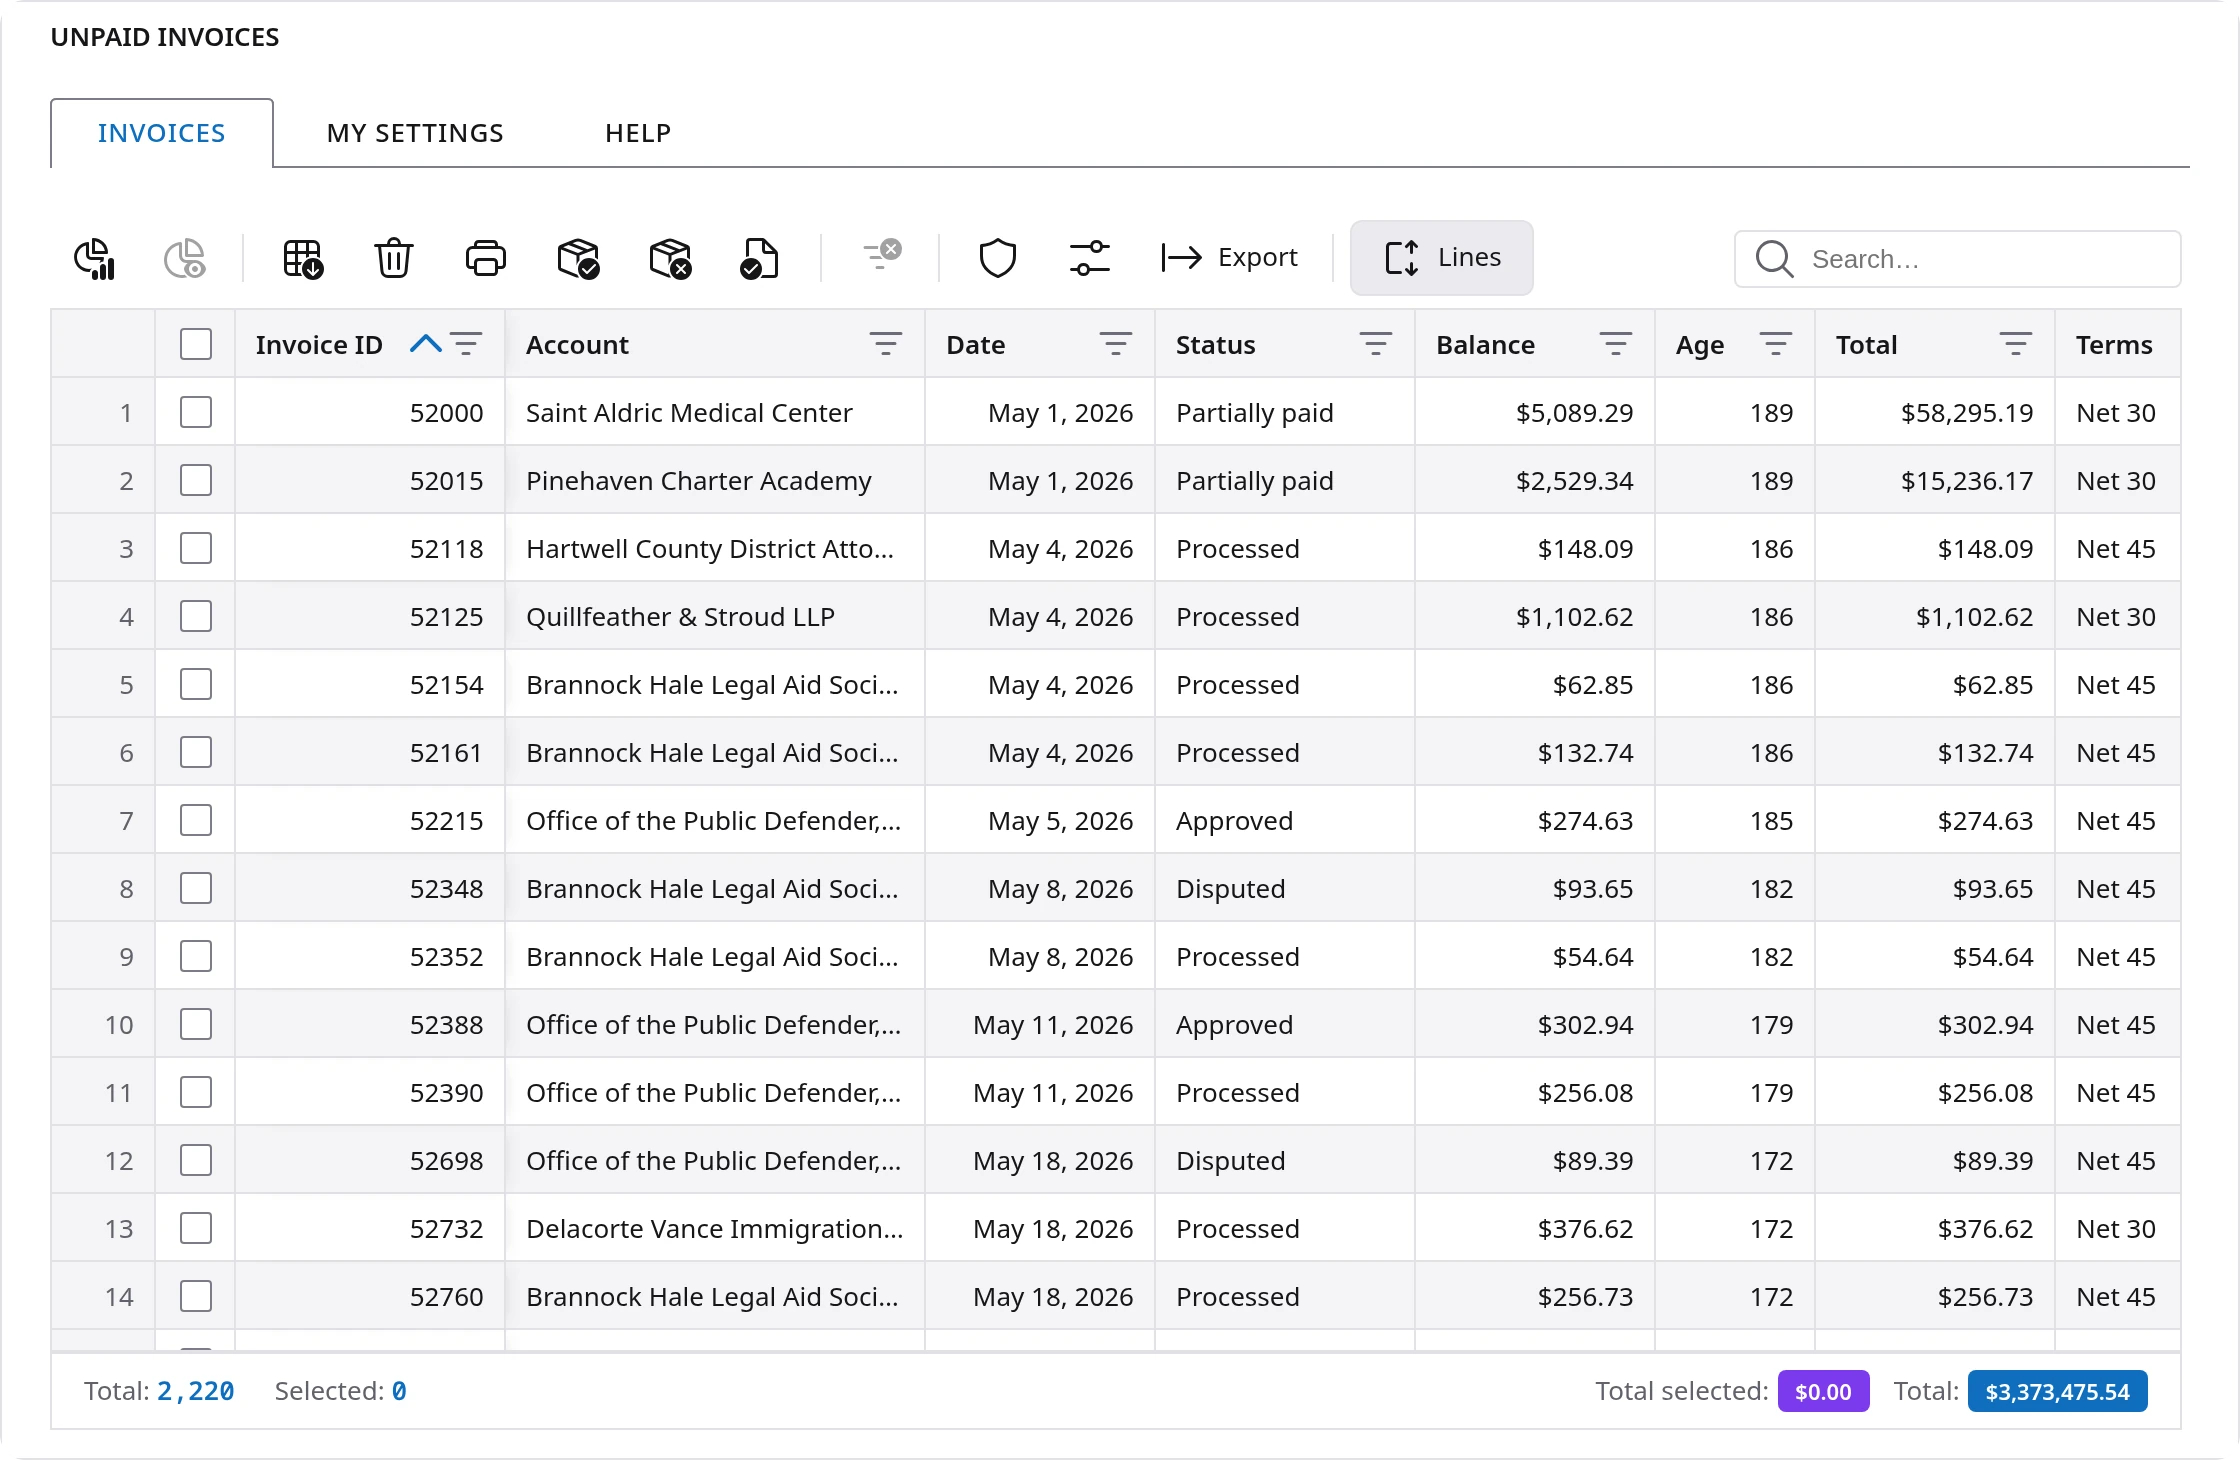
Three columns do most of the talking:
- Balance is what is still owed on the invoice.
- Age is new. It is the number of days since the invoice date. An invoice dated 30 days ago has an age of 30, whatever its terms.
- Terms is how long the customer has to pay, such as Net 30 or Net 60.
Under the list, the totals add up the balance for you. Total is everything on the list. Tick a few invoices and Total selected adds up just those. Filter or search the list and Total visible adds up what is left on the screen. You no longer need to export the list to a spreadsheet to answer "how much is that?"
Aging, explained
Aging is the oldest tool in collections, and for a good reason. An invoice that is a week old is usually just waiting for the next payment run. An invoice that is four months old has a problem: it was lost, disputed, sent to the wrong person or never approved. The older an invoice gets, the harder it is to collect, so knowing the age of what you are owed tells you where to look first.
Two words do the work here, and they are easy to mix up:
- Age counts the days since the invoice date.
- Overdue means the age is past the invoice's terms. A Net 30 invoice becomes overdue on day 31. A Net 60 invoice of the same age is still on time.
The Dashboard sorts the unpaid amount into the five age groups that finance teams use everywhere:
| Age | What it usually means | What to do |
|---|---|---|
| 0 to 30 days | New invoices, most still within their terms | Nothing yet. This is money on its way. |
| 31 to 60 days | Net 30 invoices are now overdue. Net 45 and Net 60 are coming due | A friendly reminder to customers on Net 30. |
| 61 to 90 days | Late for almost every customer | A call. Ask if the invoice reached the right person and if anything is holding it. |
| 91 to 120 days | Something is wrong with the invoice or the payment | Check for a dispute, a missing approval or a wrong address. Fix the cause. |
| Over 120 days | At risk of never being paid | Escalate, and decide how to handle it with your finance lead. |
A healthy business has most of its unpaid amount in the first group, and the bars get smaller from left to right. When the older bars start to grow, it is time to act.
Hello, Dashboard
The first button on the toolbar above the list opens the Dashboard. It opens in its own tab, next to Invoices, and stays there while you work, so you can switch between the list and the picture as often as you like. The tab shows the dates the Dashboard covers, such as Dashboard: May 1, 2026 - Nov 5, 2026.
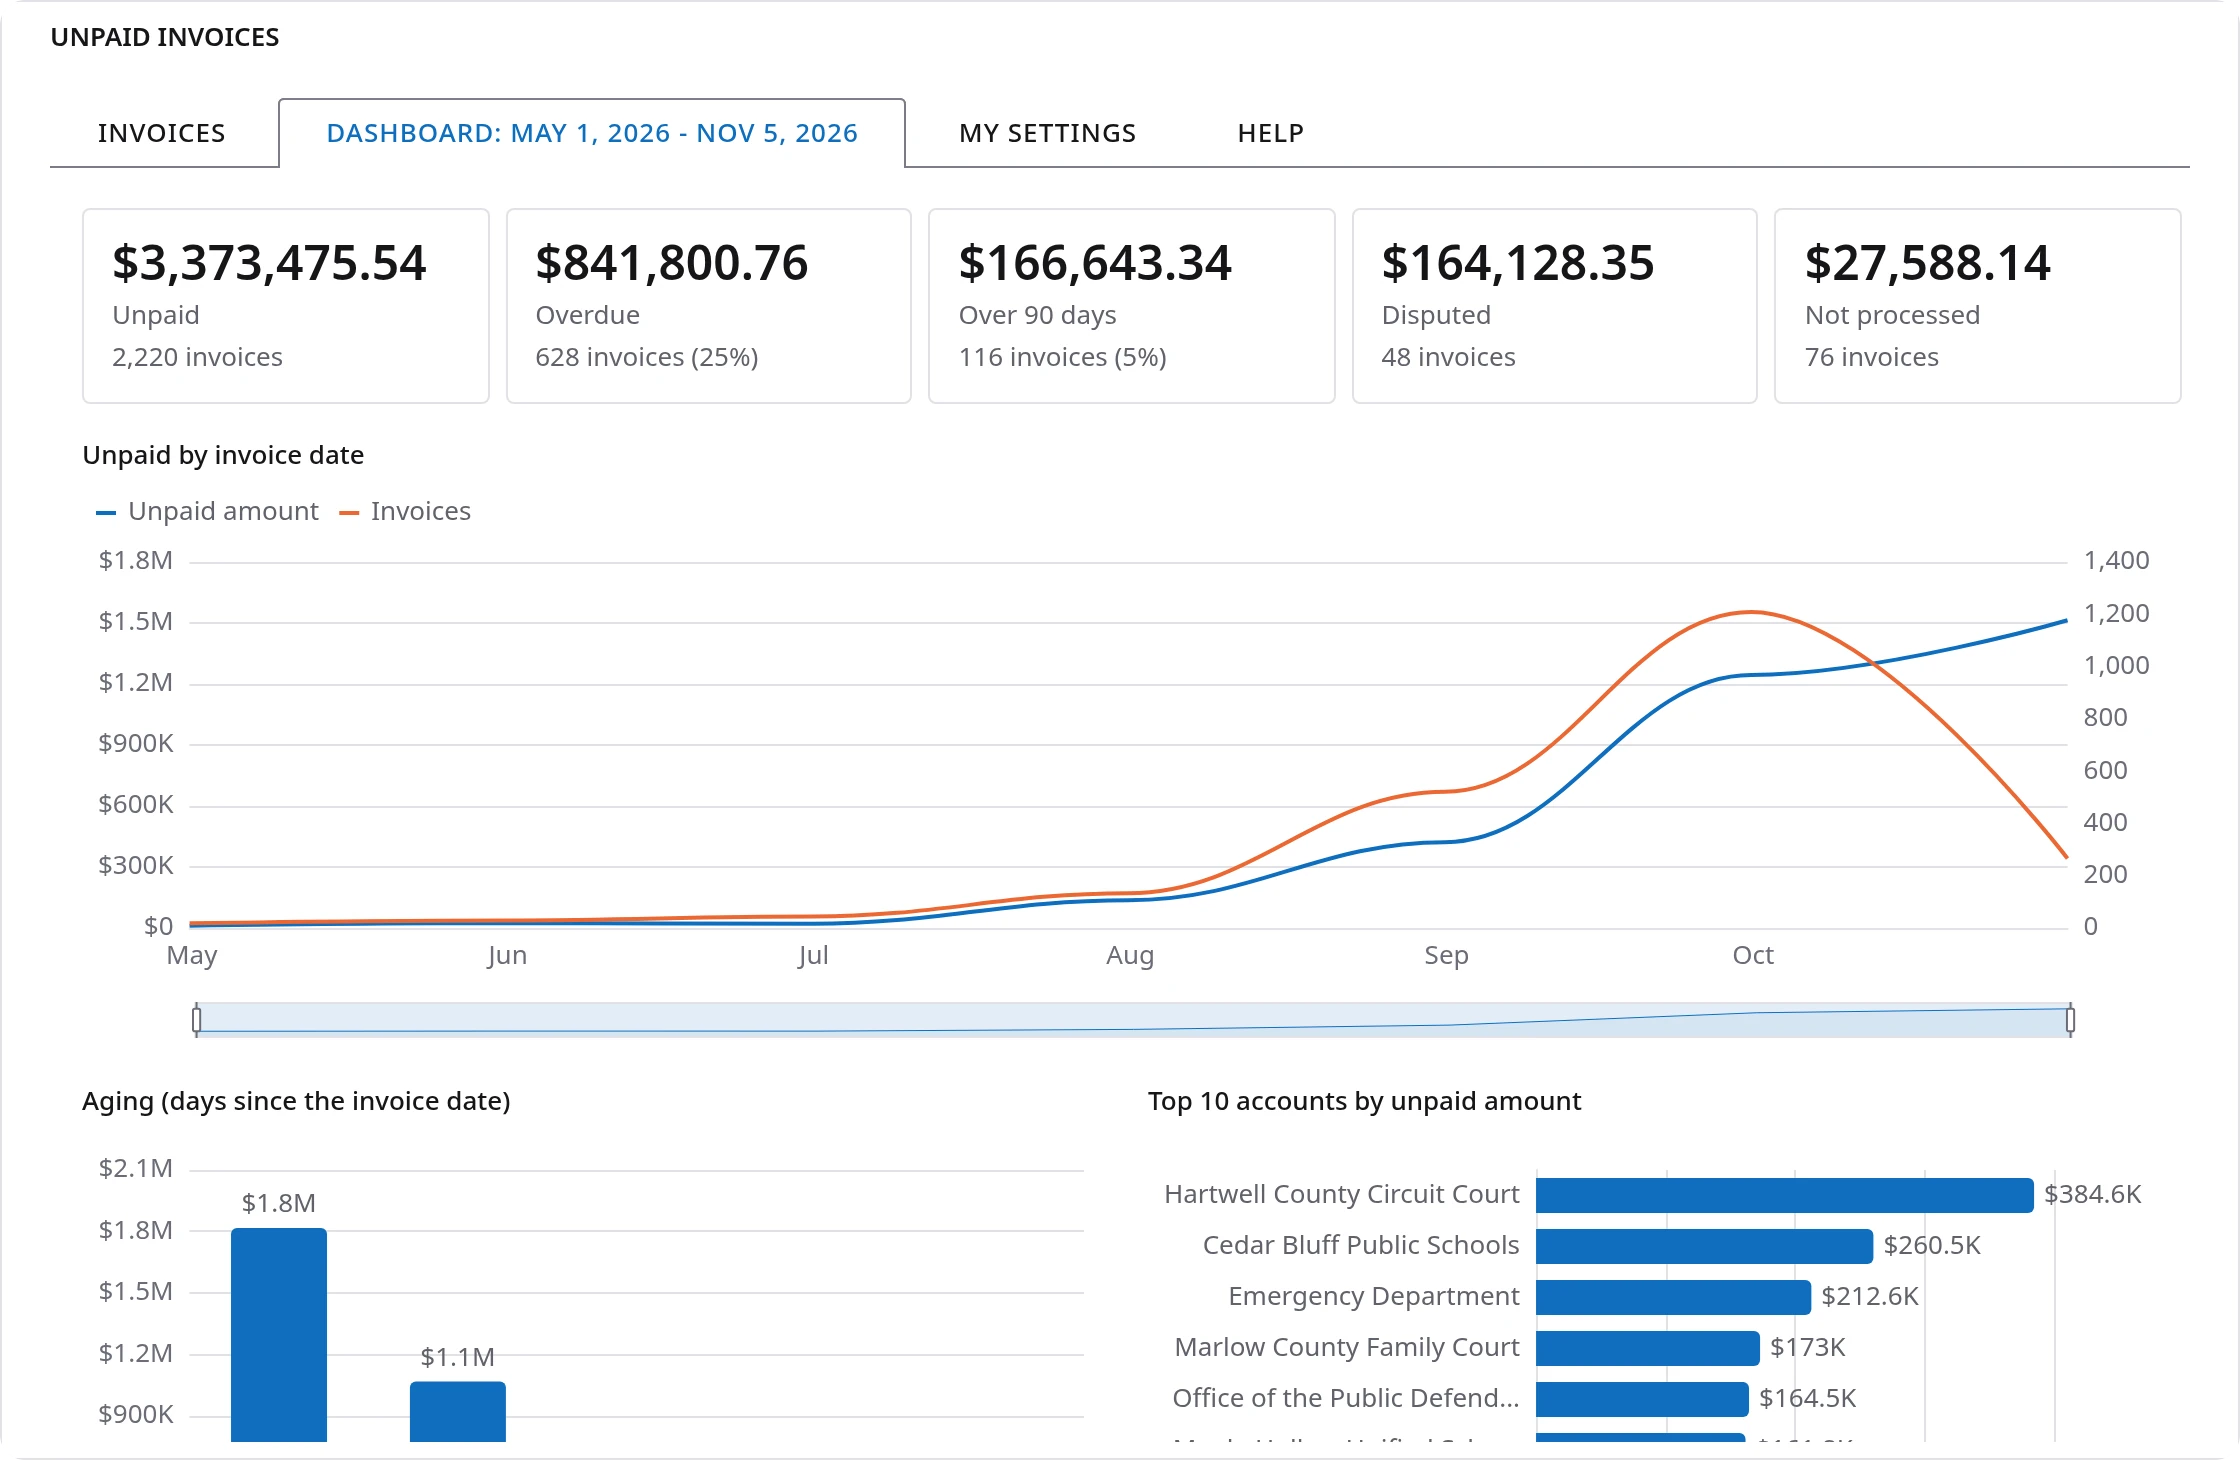
Across the top are five numbers, each with the count of invoices behind it:
| Tile | What it counts |
|---|---|
| Unpaid | Everything still owed. It matches the Total under the list. |
| Overdue | Invoices whose age is past their terms, and their share of the unpaid amount. |
| Over 90 days | Invoices more than 90 days old, and their share of the unpaid amount. |
| Disputed | Invoices a customer has questioned. These need an answer before they can be paid. |
| Not processed | Invoices that were never processed, so the customer may not even have them yet. |
Under the tiles, the timeline shows the unpaid amount and the number of unpaid invoices by invoice date, month by month. It shows at a glance whether old invoices are piling up or the open balance is mostly recent work.
Scroll down and four charts answer the next questions:
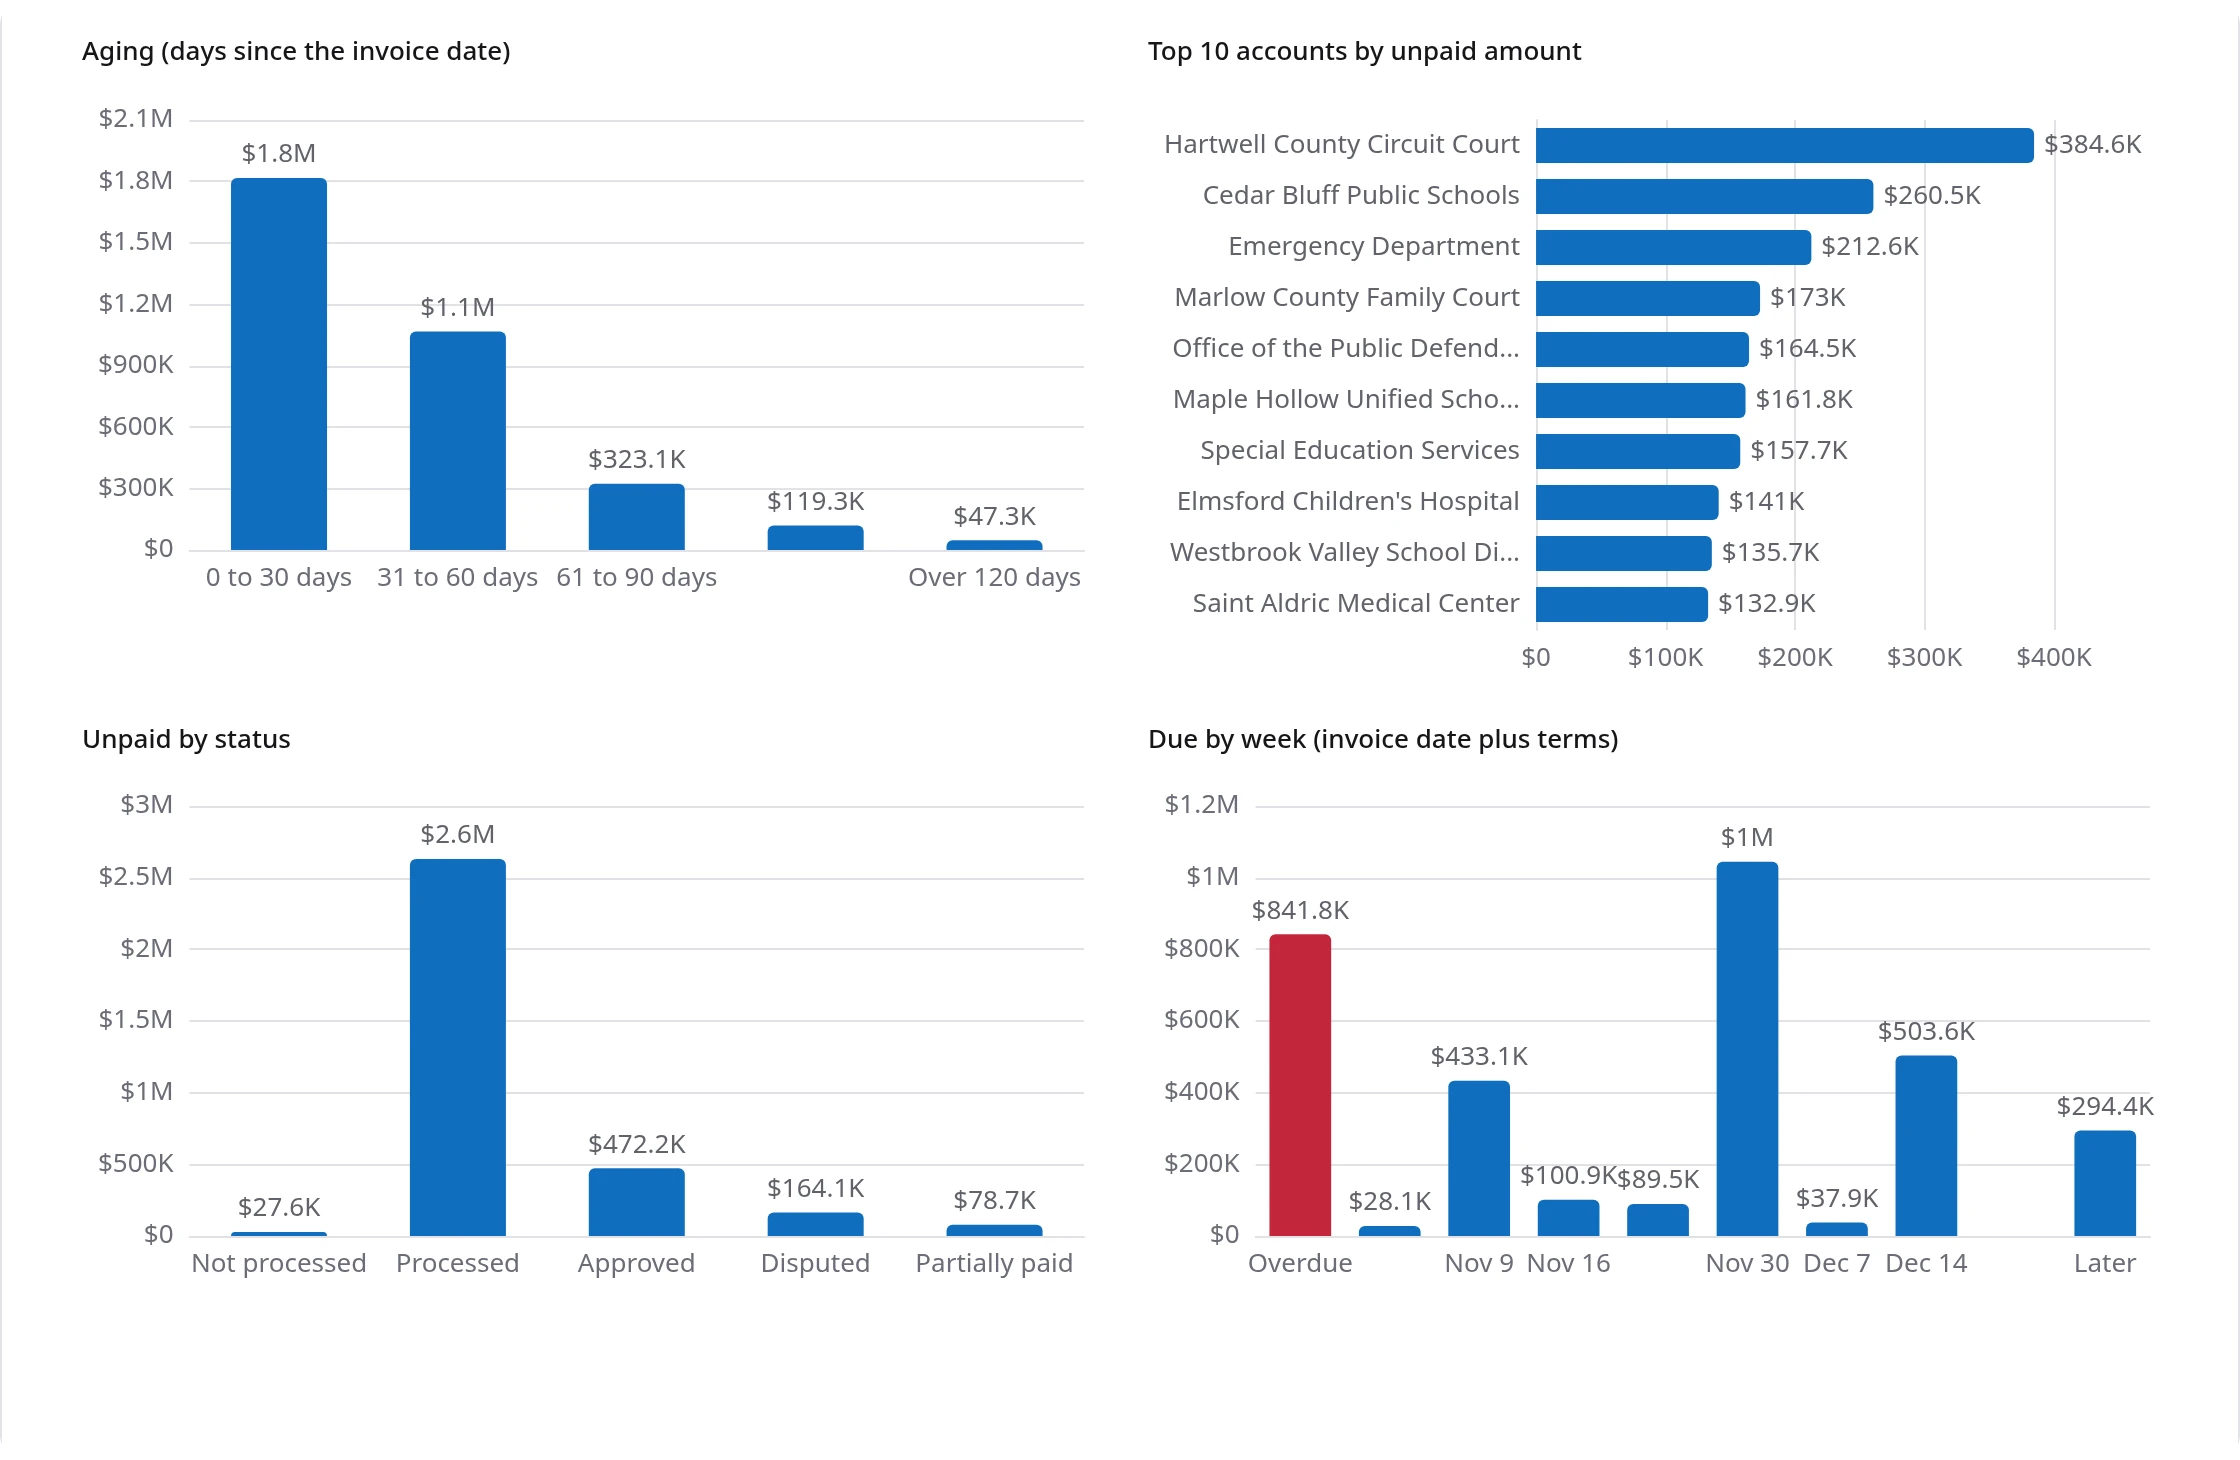
- Aging sorts the unpaid amount into the five age groups described above.
- Top 10 accounts by unpaid amount shows who owes the most, largest first.
- Unpaid by status shows how much is not processed, processed, approved, disputed or partially paid. A tall Not processed or Disputed bar is work waiting on your side.
- Due by week adds each invoice's terms to its date and shows what falls due this week and in each of the next weeks. The first bar, in red, is what is already overdue. It is a simple way to see the money that should come in soon.
Rest the pointer on any bar or point to read its exact amount.
Zoom in on a period
The timeline does more than show history. It decides what the rest of the Dashboard looks at. Drag the handles of the slider under the timeline to choose a period, and everything follows: the five tiles, the four charts and the dates on the tab. Choose the last three months and the Dashboard tells you about the last three months, all of it at once.

Two more ways to zoom: hold Shift and turn the mouse wheel over the timeline to zoom in and out around the pointer, or pinch on a trackpad. A plain turn of the wheel scrolls the page as usual, so the Dashboard never traps your scrolling.
The charts move to their new values when the period changes, so you can see what changed, not just the result. If you have asked your computer to reduce motion, the Dashboard respects that and the charts change without moving.
Filter the list, then see its Dashboard
The Dashboard shows every unpaid invoice. Often you want to look at a slice: one customer, one status, the invoices a search found. That is what Dashboard filtered is for.
First, filter the list the way you always do. The quickest way is to right-click a value and choose Filter by, which keeps only the rows with that value, or Exclude, which hides them. You can also use the filter on a column header or type in the search box. The menu also lists what you can do with that invoice, and it only offers what fits the invoice's status.
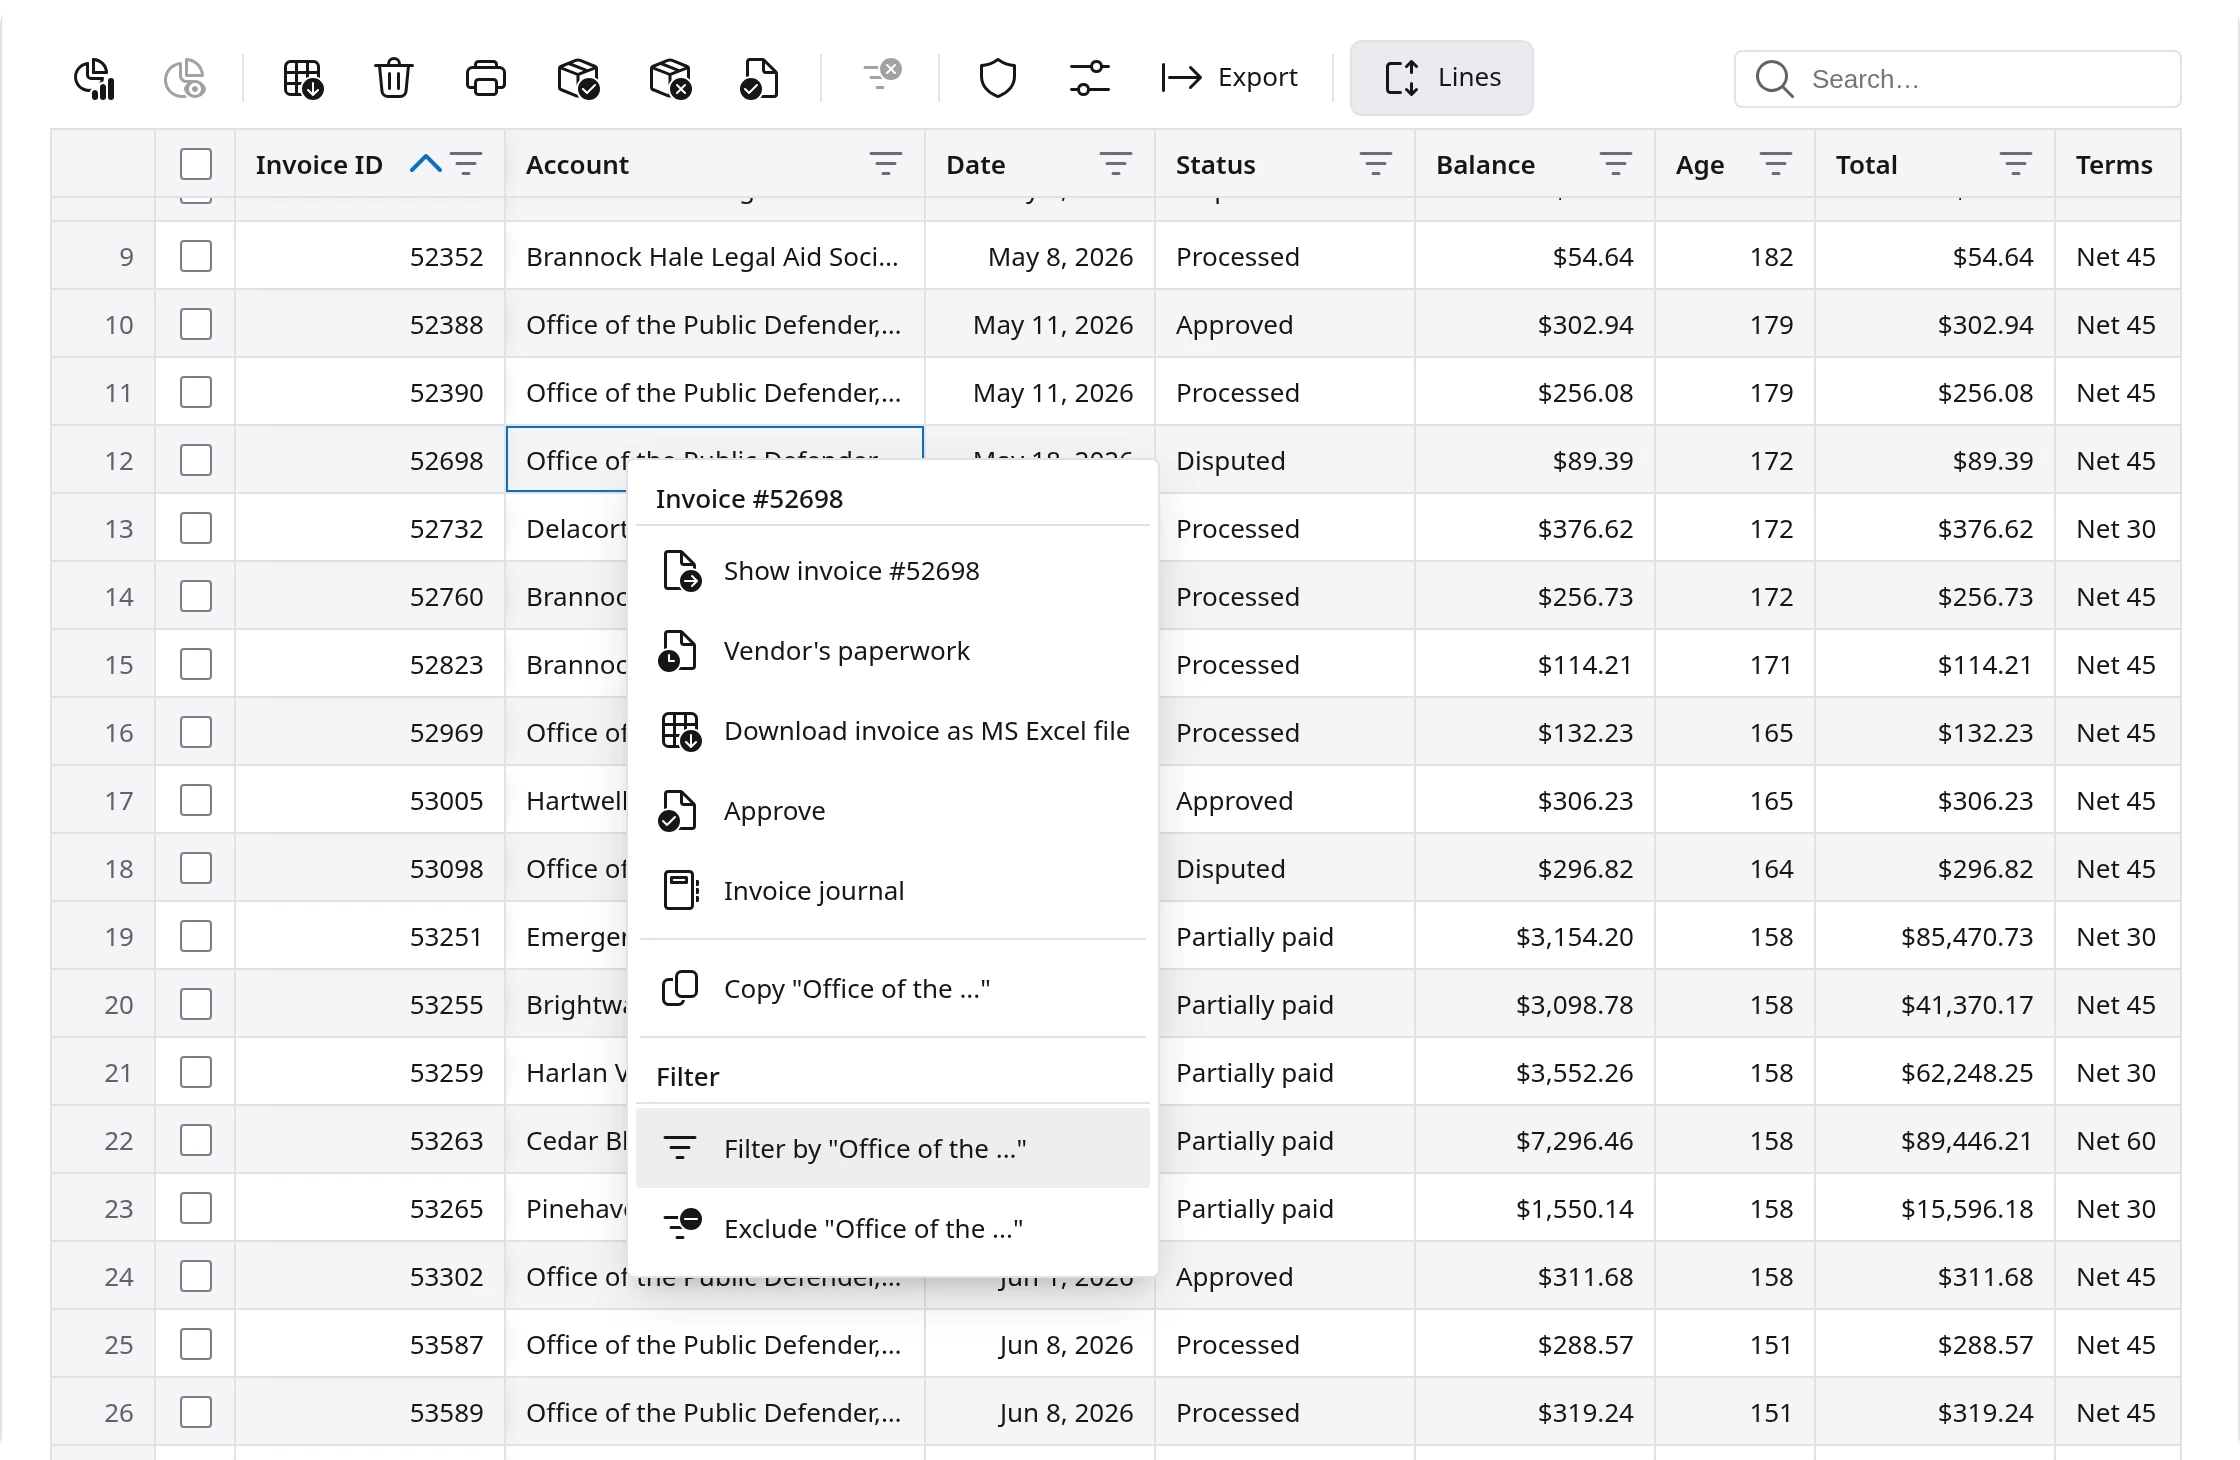
The footer tells you what the filter did: how many invoices are Visible, which columns are filtered, and the Total visible of their balance.
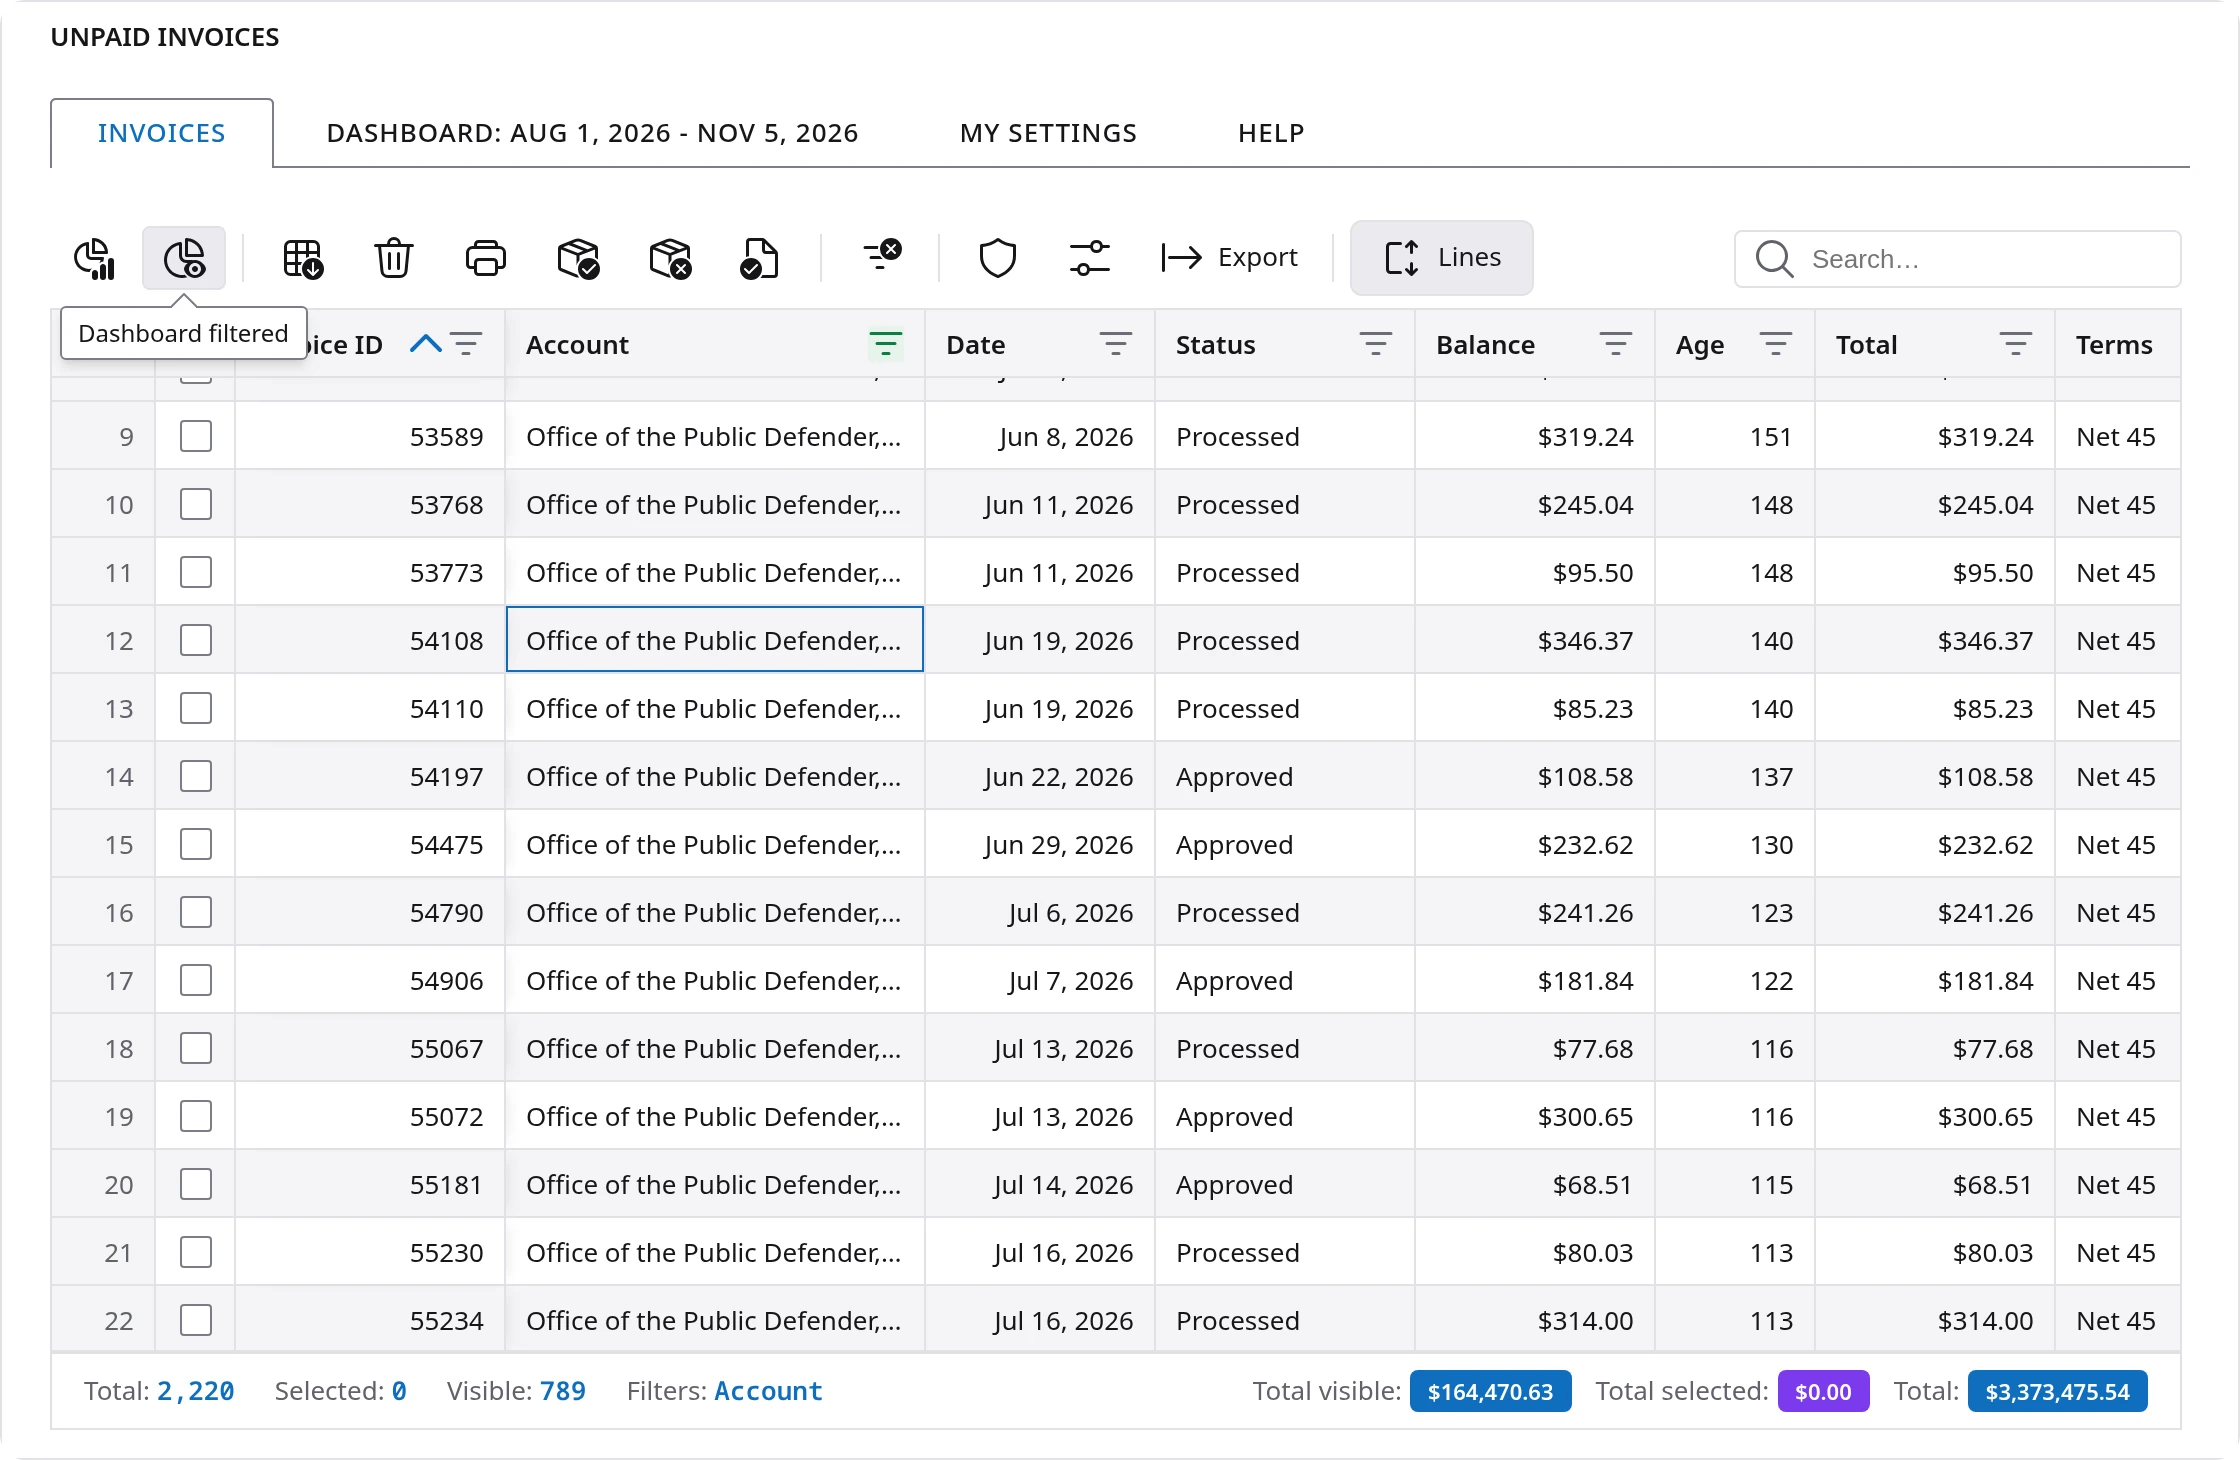
Now the second button on the toolbar, Dashboard filtered, is available. It stays greyed out while the list shows everything, because then it would be the same as the Dashboard. Click it and a new tab opens with the same Dashboard, built from only the invoices the list shows.

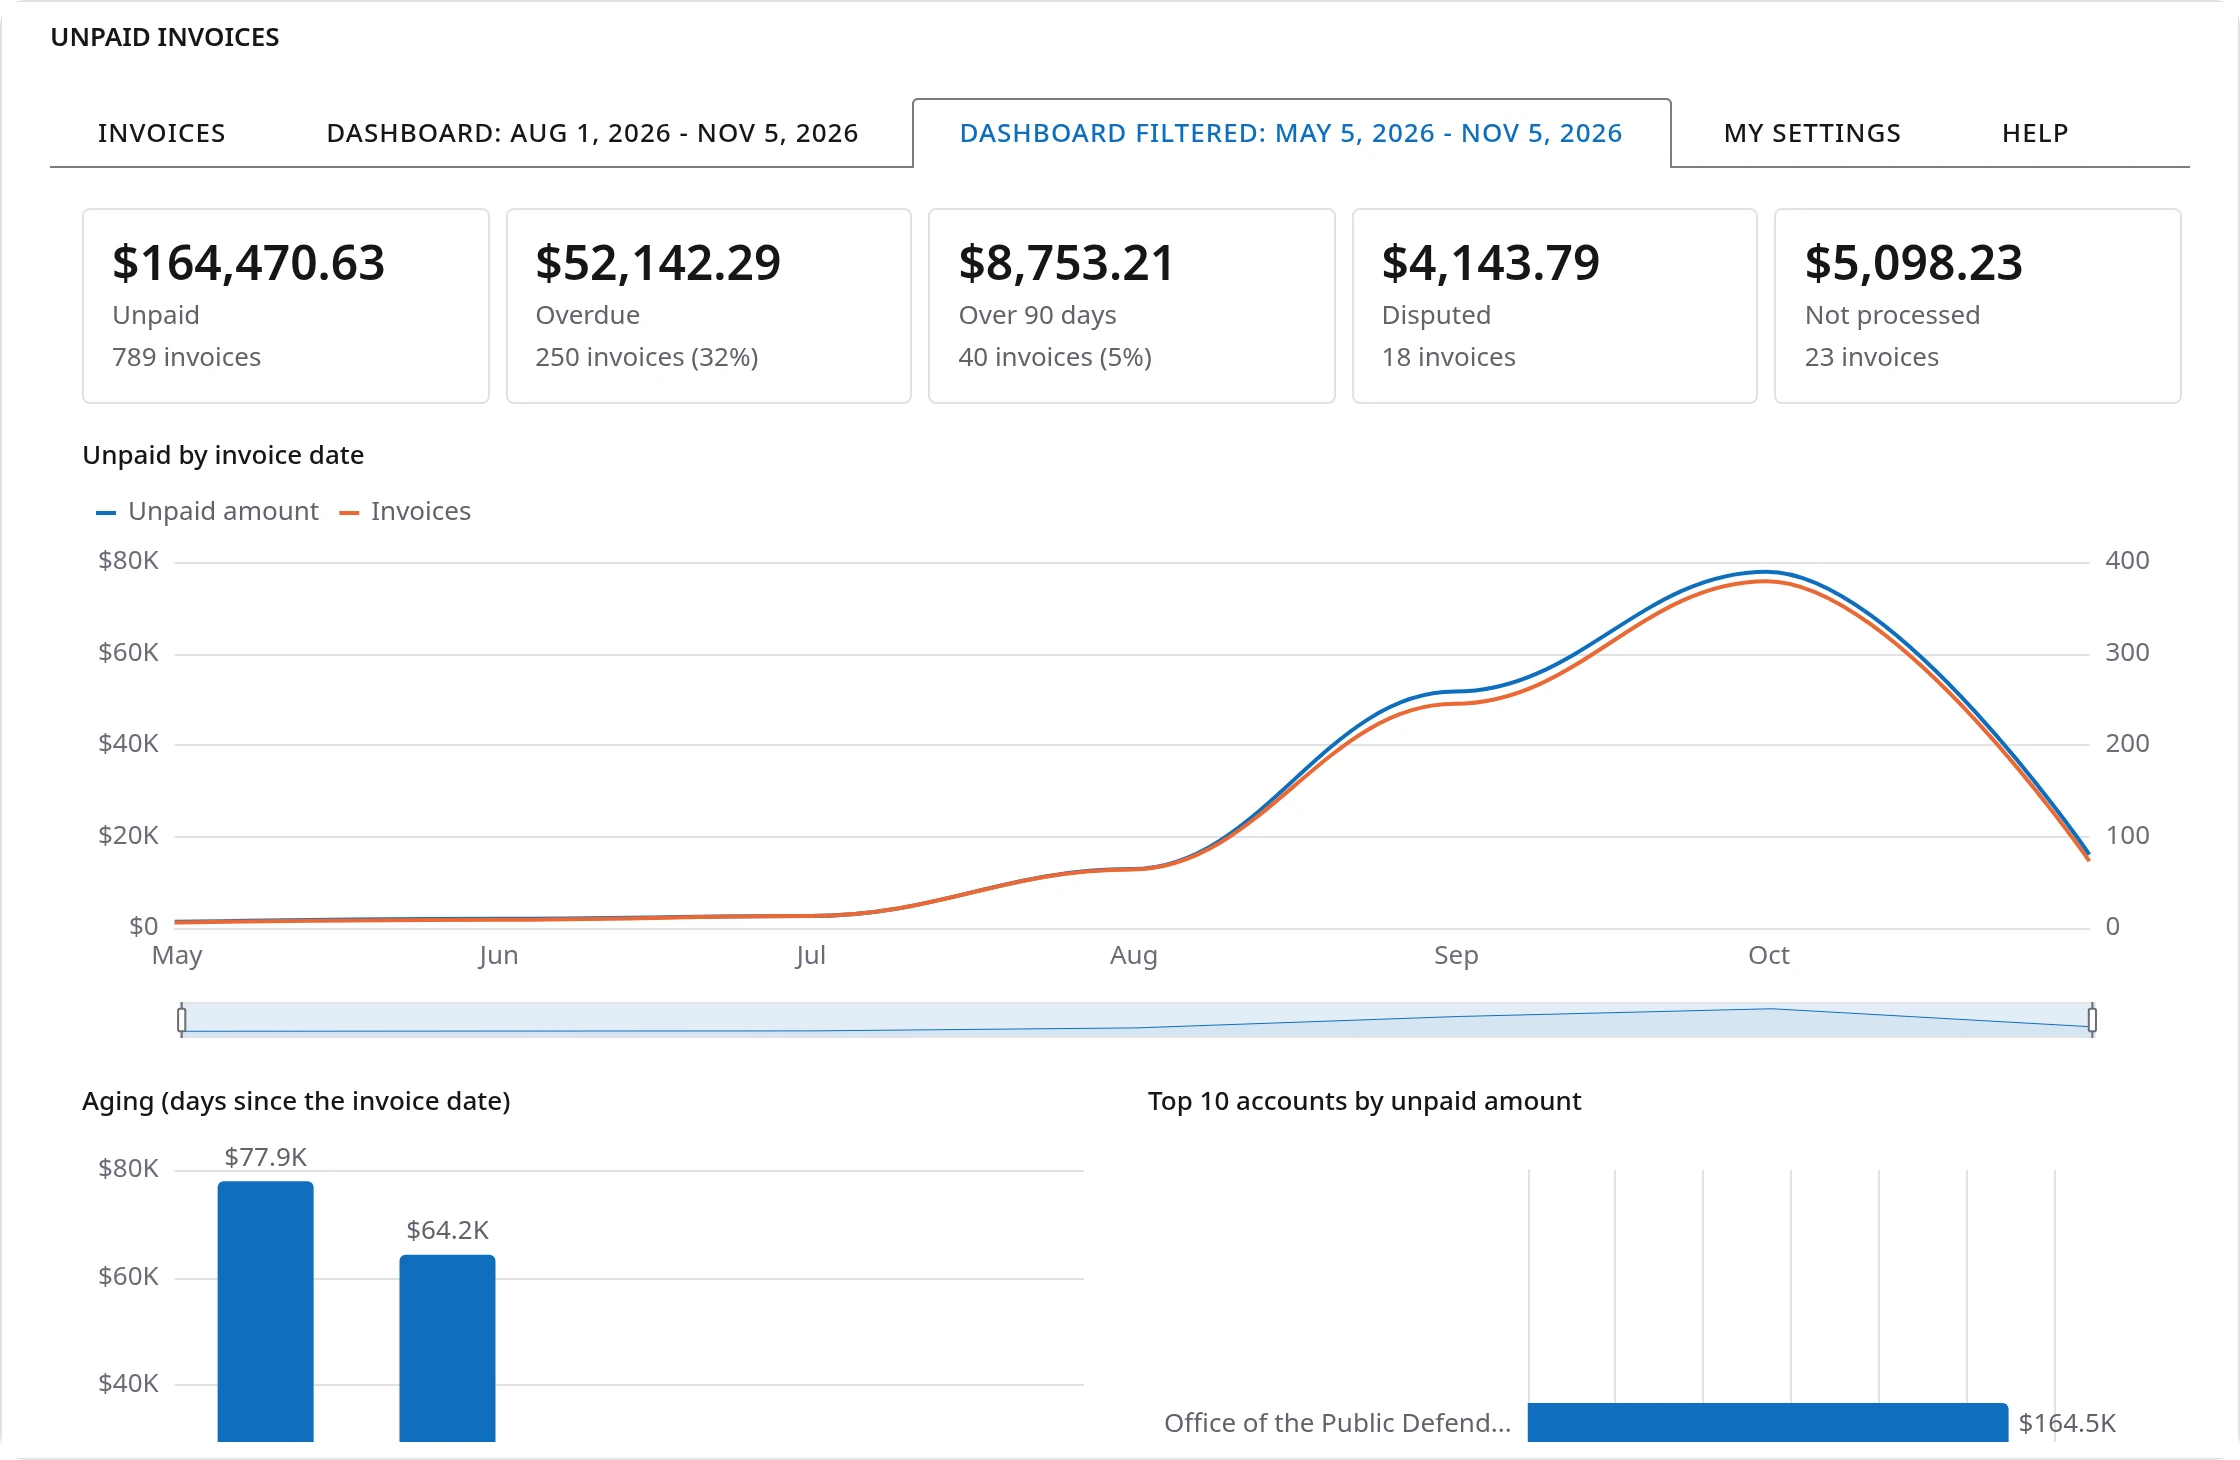
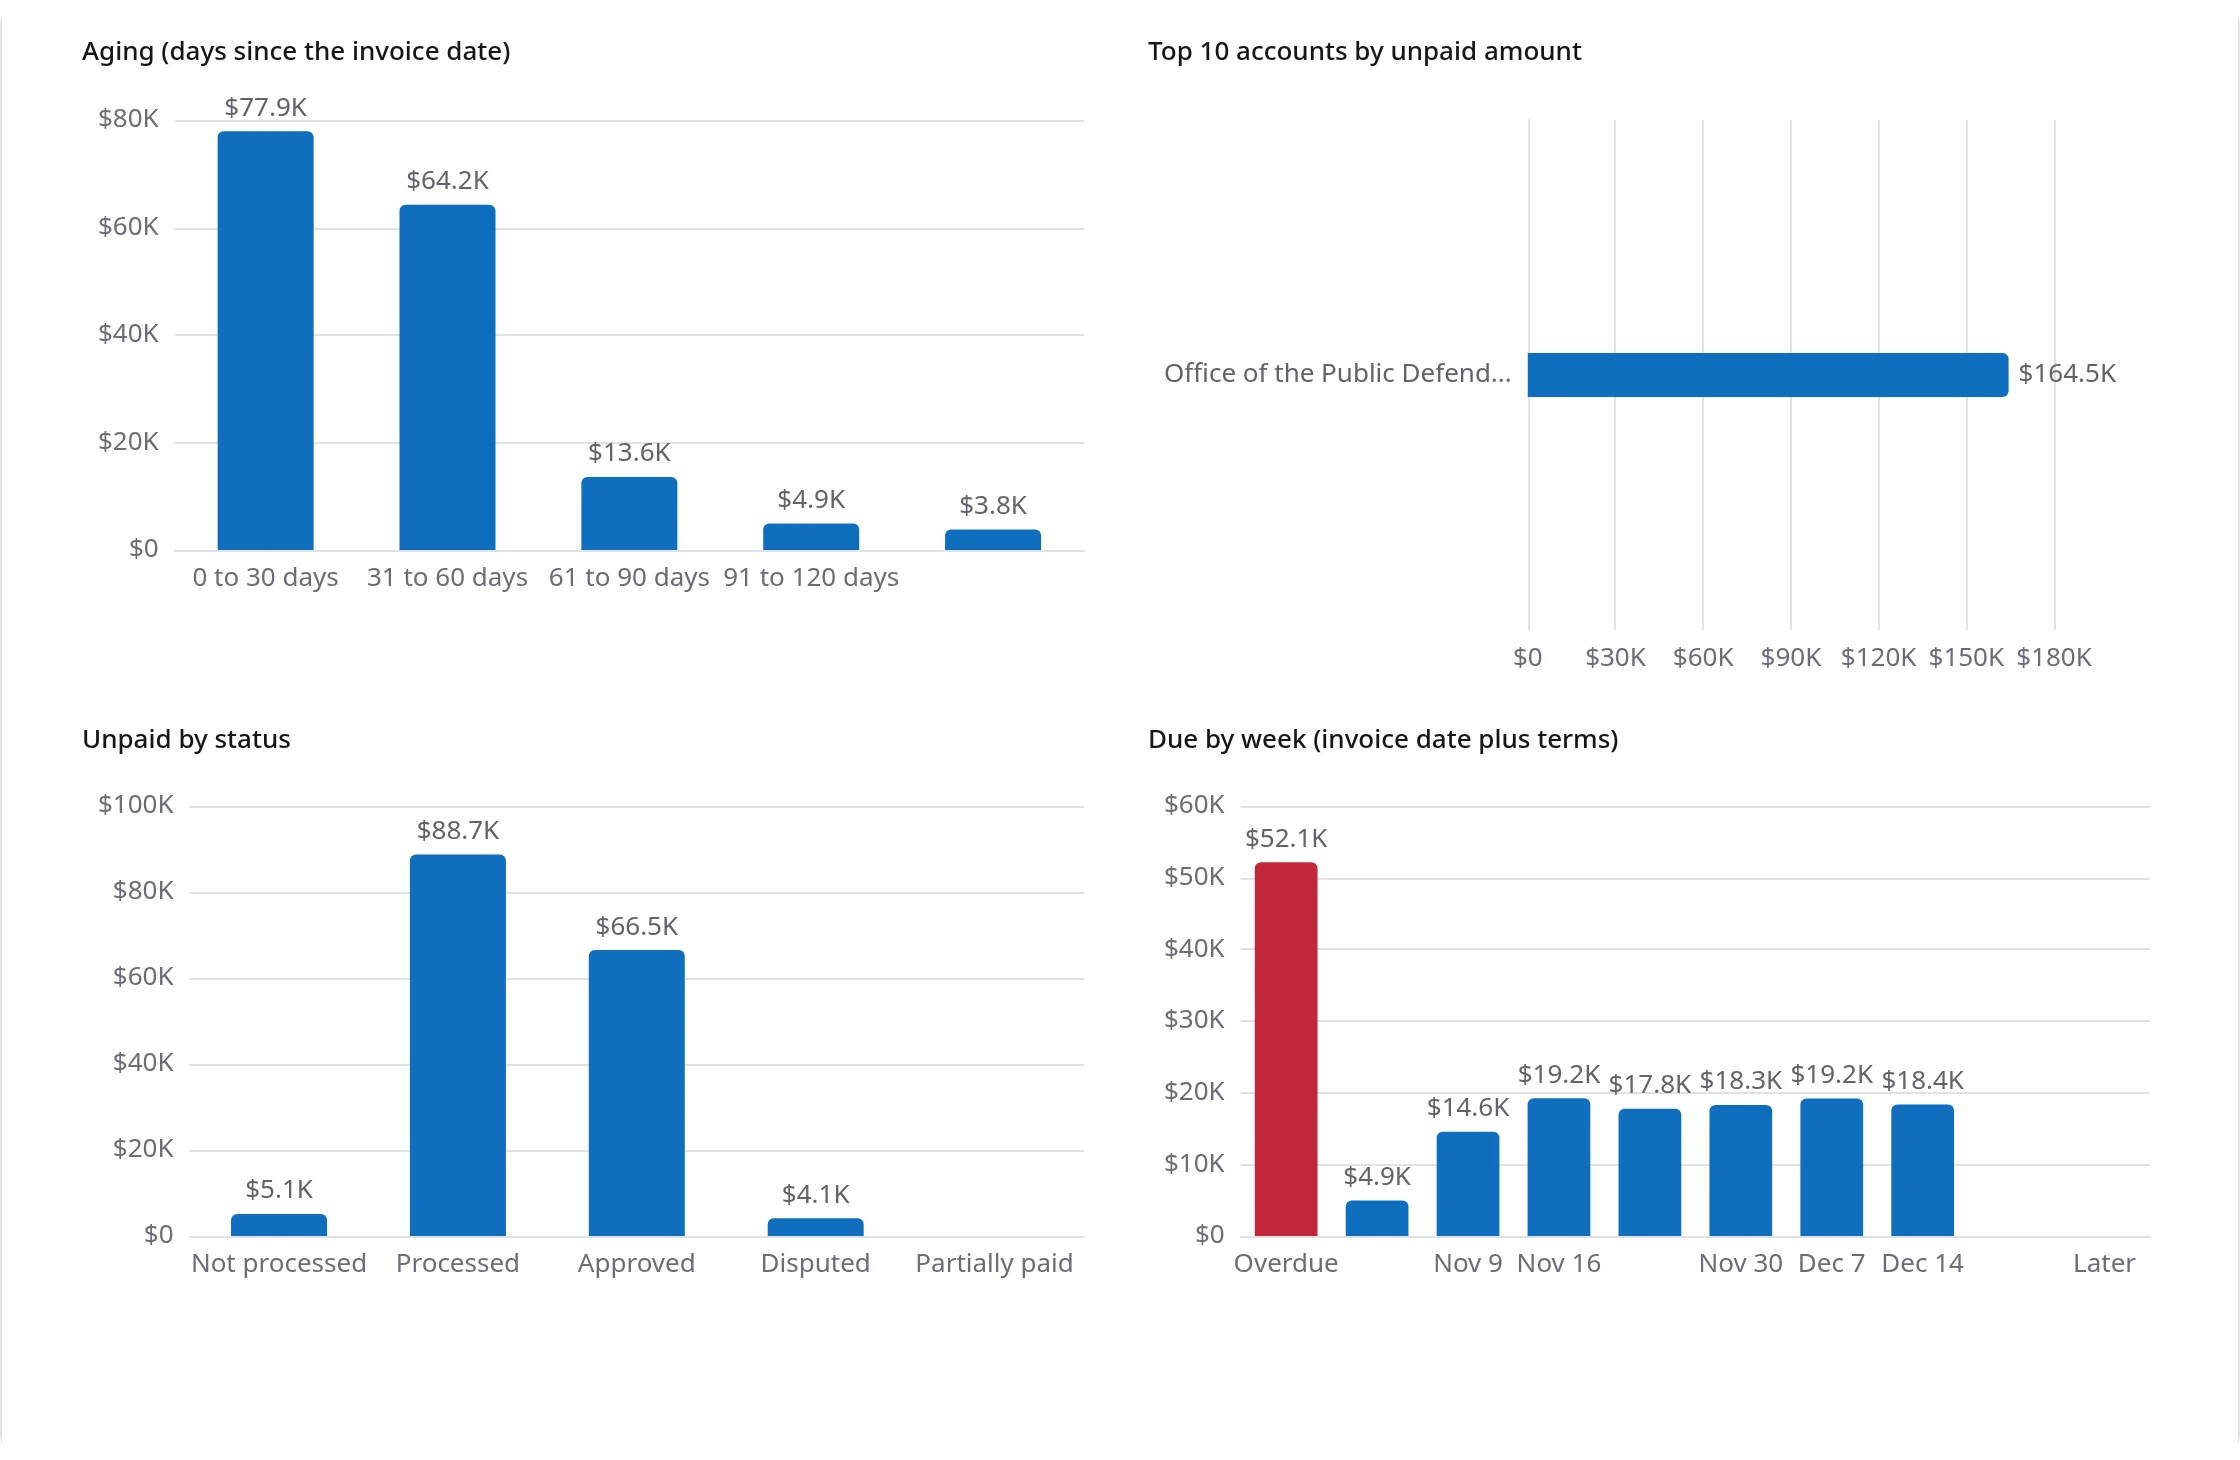
Dashboard filtered keeps up with the list. Change the filter, and it shows the new rows. Clear the filters, and its button goes back to grey. Both Dashboards can be open at the same time, so you can compare one customer with the whole picture by switching tabs.
Questions the Dashboard answers
A few ways teams use it, each in under a minute:
- Who should we call this week? Look at the Overdue and Over 90 days tiles. Then go back to the list, click the Age header to put the oldest invoices first, and work down from the top.
- How is one customer doing? Right-click their name, choose Filter by, and open Dashboard filtered. Their aging chart shows at once whether they pay on time or let invoices grow old.
- What is stuck on our side? The Not processed and Disputed tiles, and the Unpaid by status chart. Money cannot come in for an invoice the customer never received or still has questions about.
- What should come in soon? The Due by week chart. It shows the coming weeks at a glance, with the overdue amount in red on the left.
- How did last quarter end? Zoom the timeline to the quarter. The tiles and the aging chart now describe only those invoices.
Fast, and the same as the rest of Flow Platform
The Dashboard is worked out from the invoices already on your screen. It does not ask the server for anything, so it opens at once, even with thousands of invoices, and it keeps up as the list changes. The charts draw in when you first open them and when you zoom, and stay still the rest of the time.
Unpaid invoices runs on Flow UI, like the screens you use every day: the same toolbar, the same right-click menu, the same totals and the same light and dark themes. Each person can still arrange the list their own way under My Settings, and the Help tab opens the manual for this screen right where you are working.
Frequently asked questions
What happened to Invoices not paid in Flow Platform?
It was renamed Unpaid invoices, the name accounting and finance software uses for the same list. It opens from the same places, the ribbon and the Accounting menu, and it now has an Age column, totals under the list, a Dashboard and a Dashboard filtered.
Which invoices does Unpaid invoices show?
Every invoice that still has money owed on it: not processed, processed, approved, disputed and partially paid. Invoices that are paid in full or void are left out.
How is the age of an invoice worked out?
Age is the number of days since the invoice date, whatever its terms. The terms decide something else: an invoice is overdue once its age is past its terms, so a Net 30 invoice is overdue on day 31.
What is an aging report?
An aging report sorts what customers owe by how old it is, usually in 30 day steps: 0 to 30 days, 31 to 60, 61 to 90, 91 to 120 and over 120. The older an invoice, the harder it is to collect, so aging shows where to look first. The Unpaid invoices Dashboard has an aging chart that updates as you zoom and filter.
Can I see the dashboard for one customer only?
Yes. Filter the list to that customer, for example by right-clicking their name and choosing Filter by, then open Dashboard filtered from the toolbar. It shows the same numbers and charts for only the invoices the list shows.
How do I look at one period on the Dashboard?
Drag the handles of the slider under the timeline, or hold Shift and turn the mouse wheel over the timeline. Every number and chart on the Dashboard, and the dates on its tab, follow the period you choose.
Does the Dashboard slow the page down?
No. The Dashboard is worked out from the invoices already on the screen, without asking the server for anything, and it opens at once.
Questions or ideas for the Dashboard? Let us know through the Help Desk.